Tinybird Setup
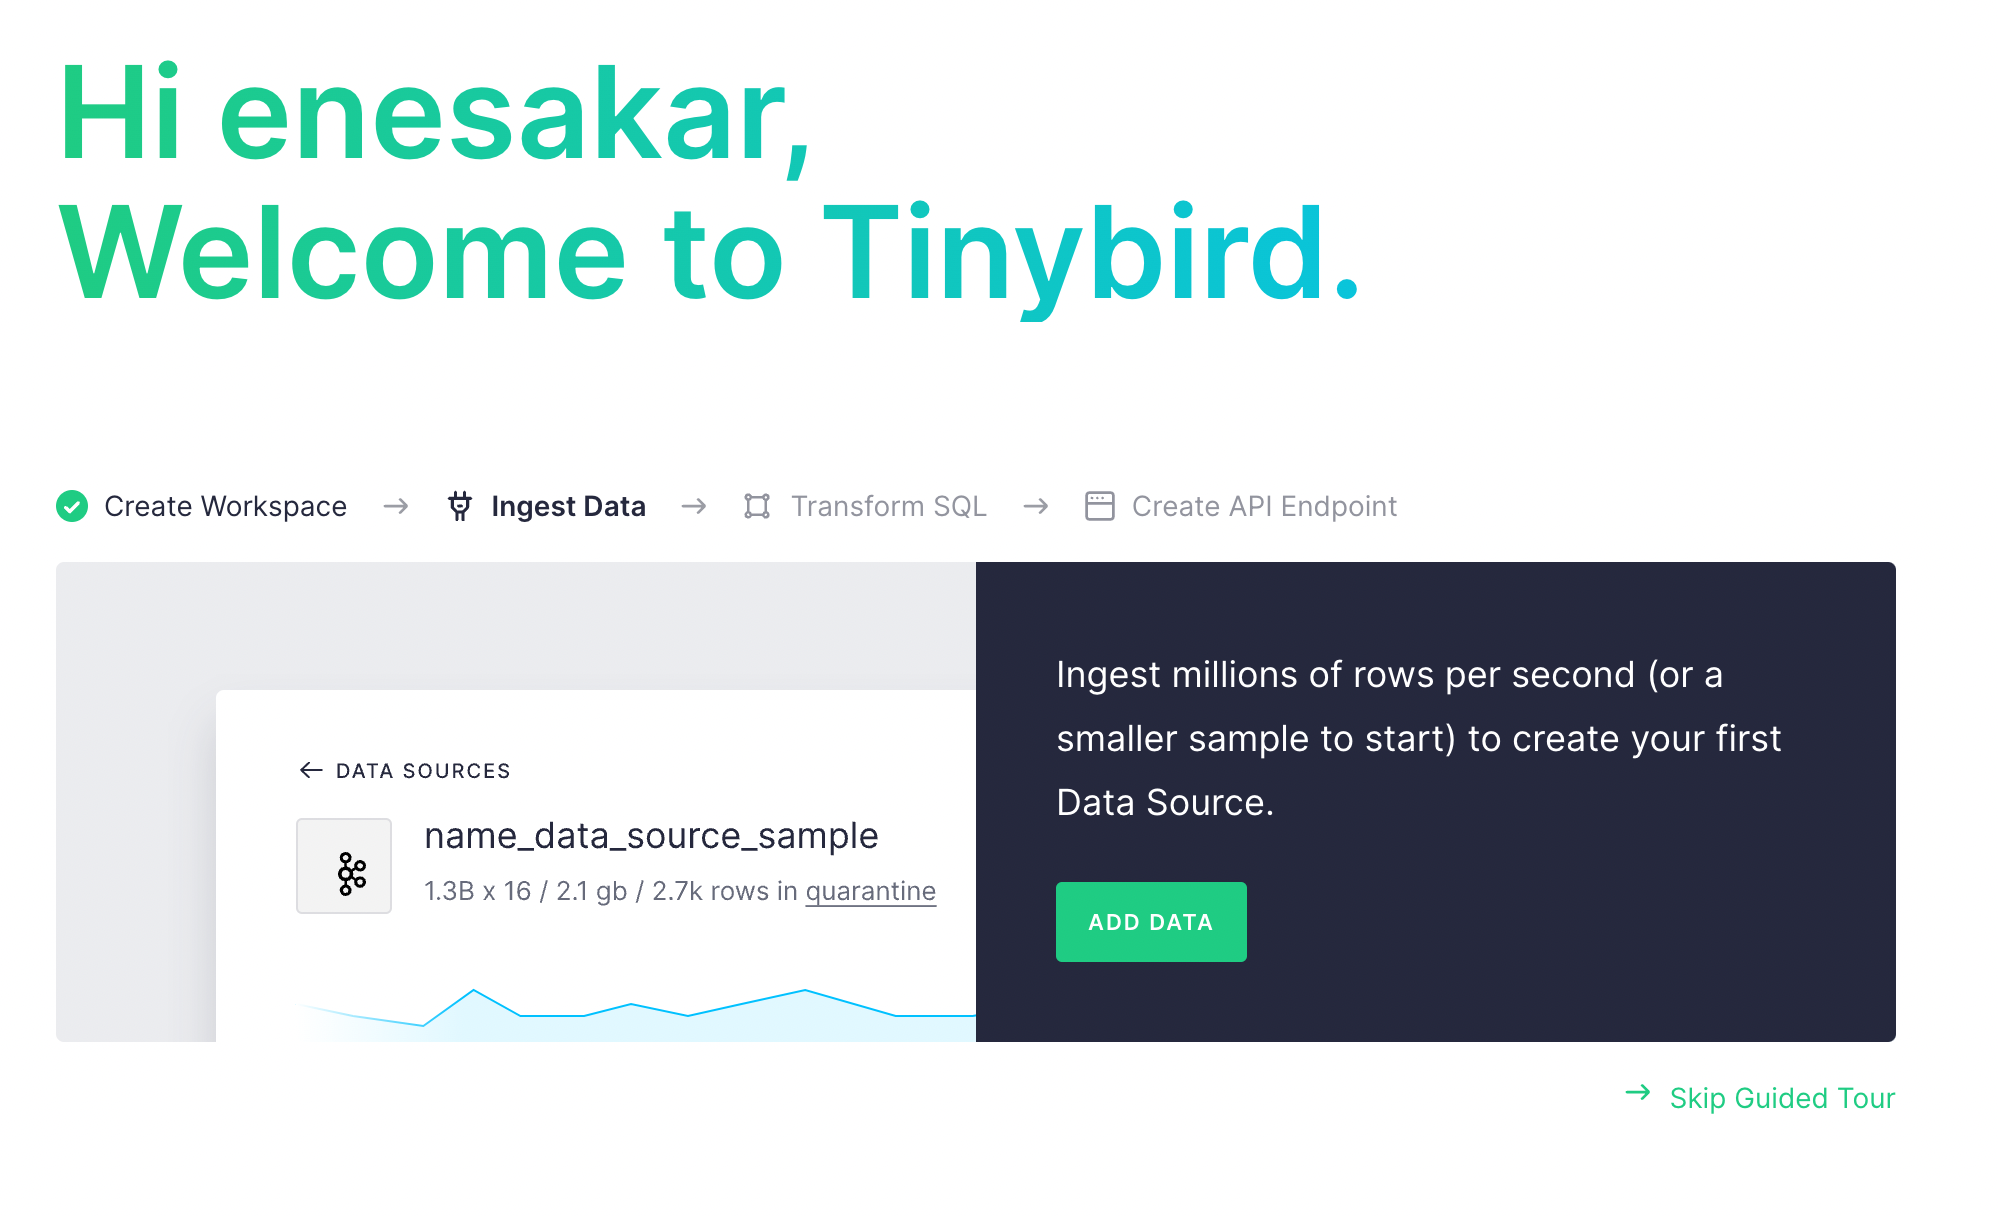
Create a Tinybird account and select a region. Create an empty workspace. On the wizard screen clickAdd Data button.
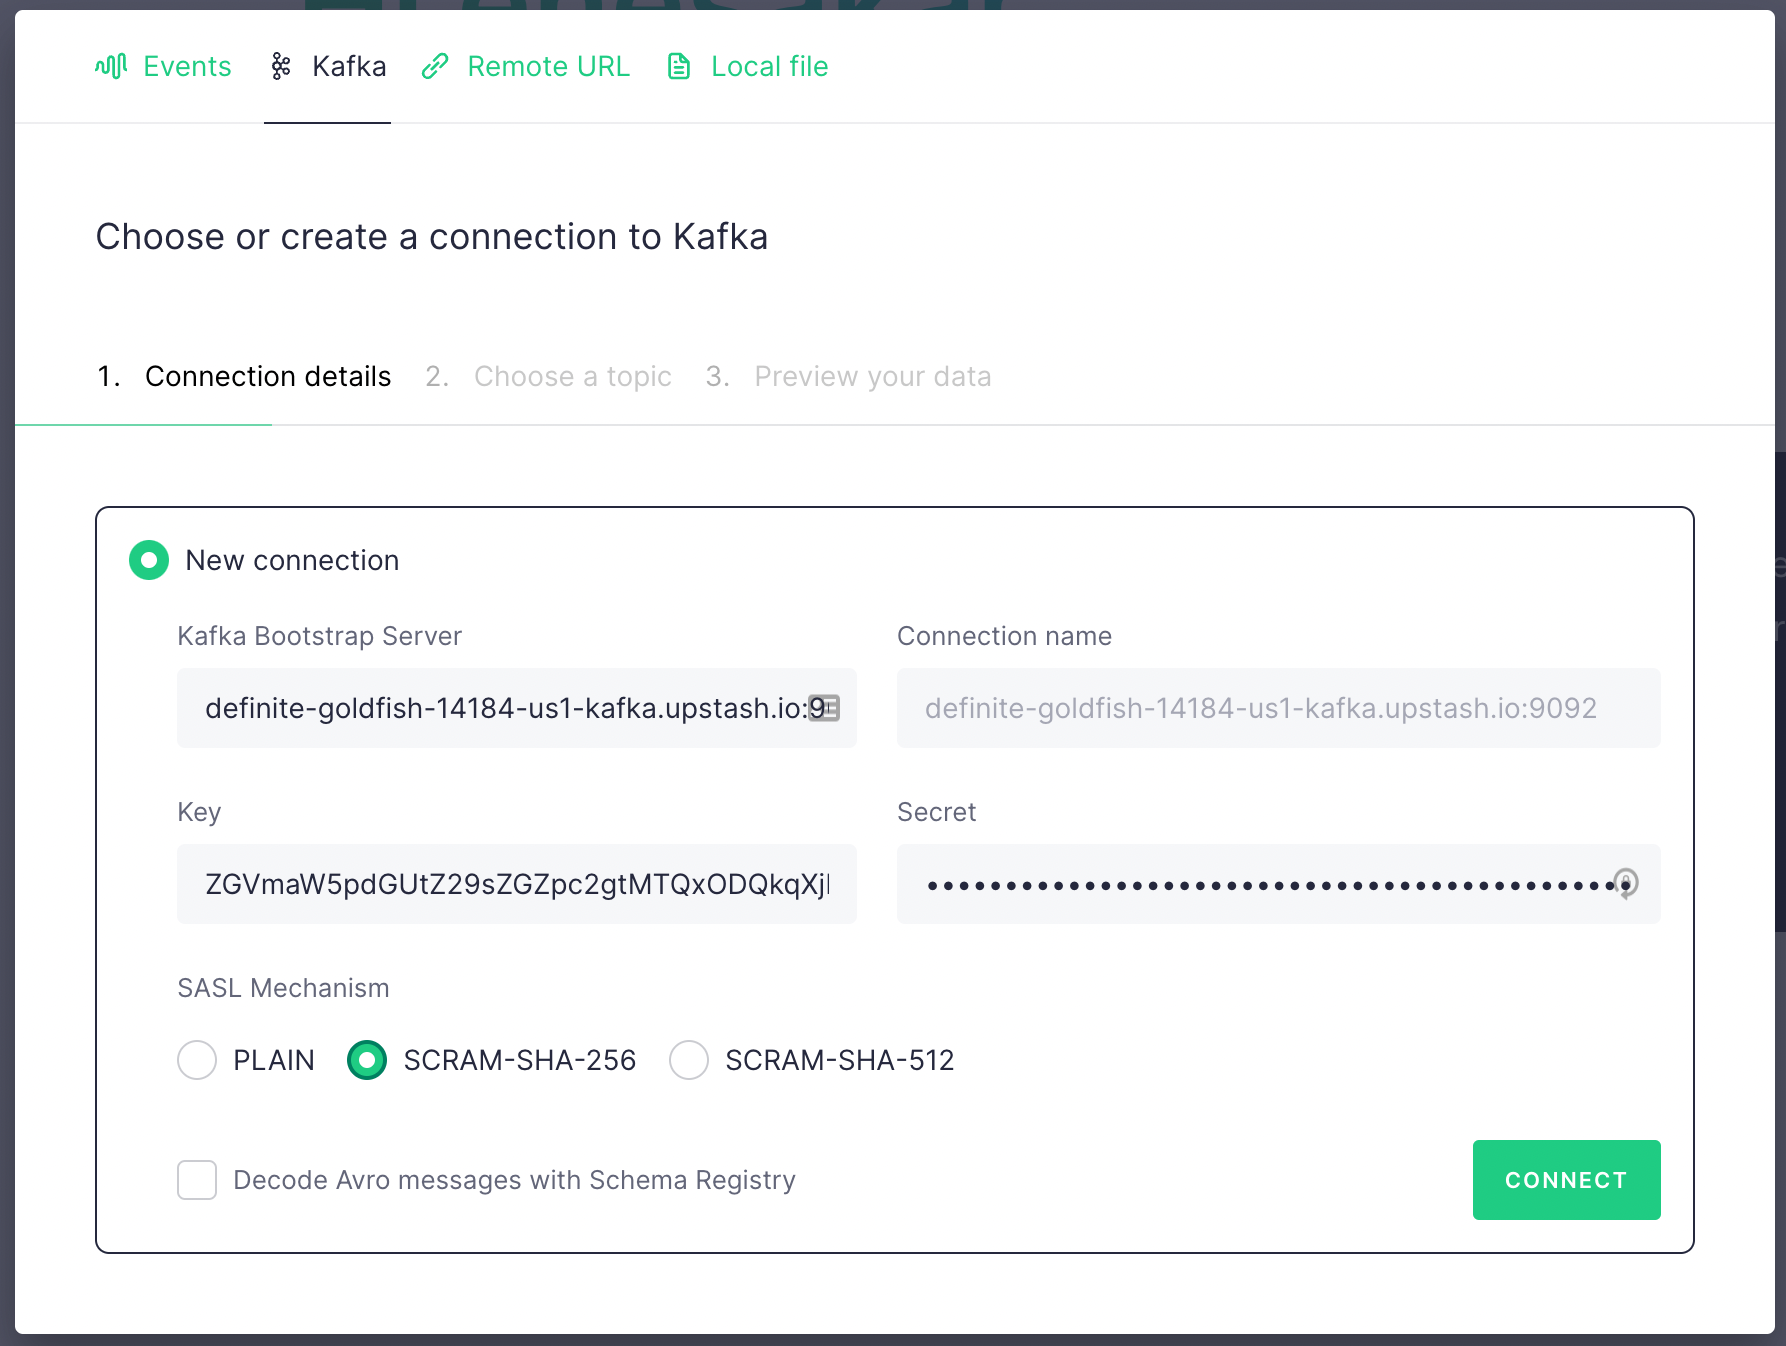
 In the next screen click on Kafka tab and fill the fields with the credentials
copied from Upstash Kafka console. Key is
 username , secret is password .
Select SCRAM-SHA-256. Then click on Connect button.
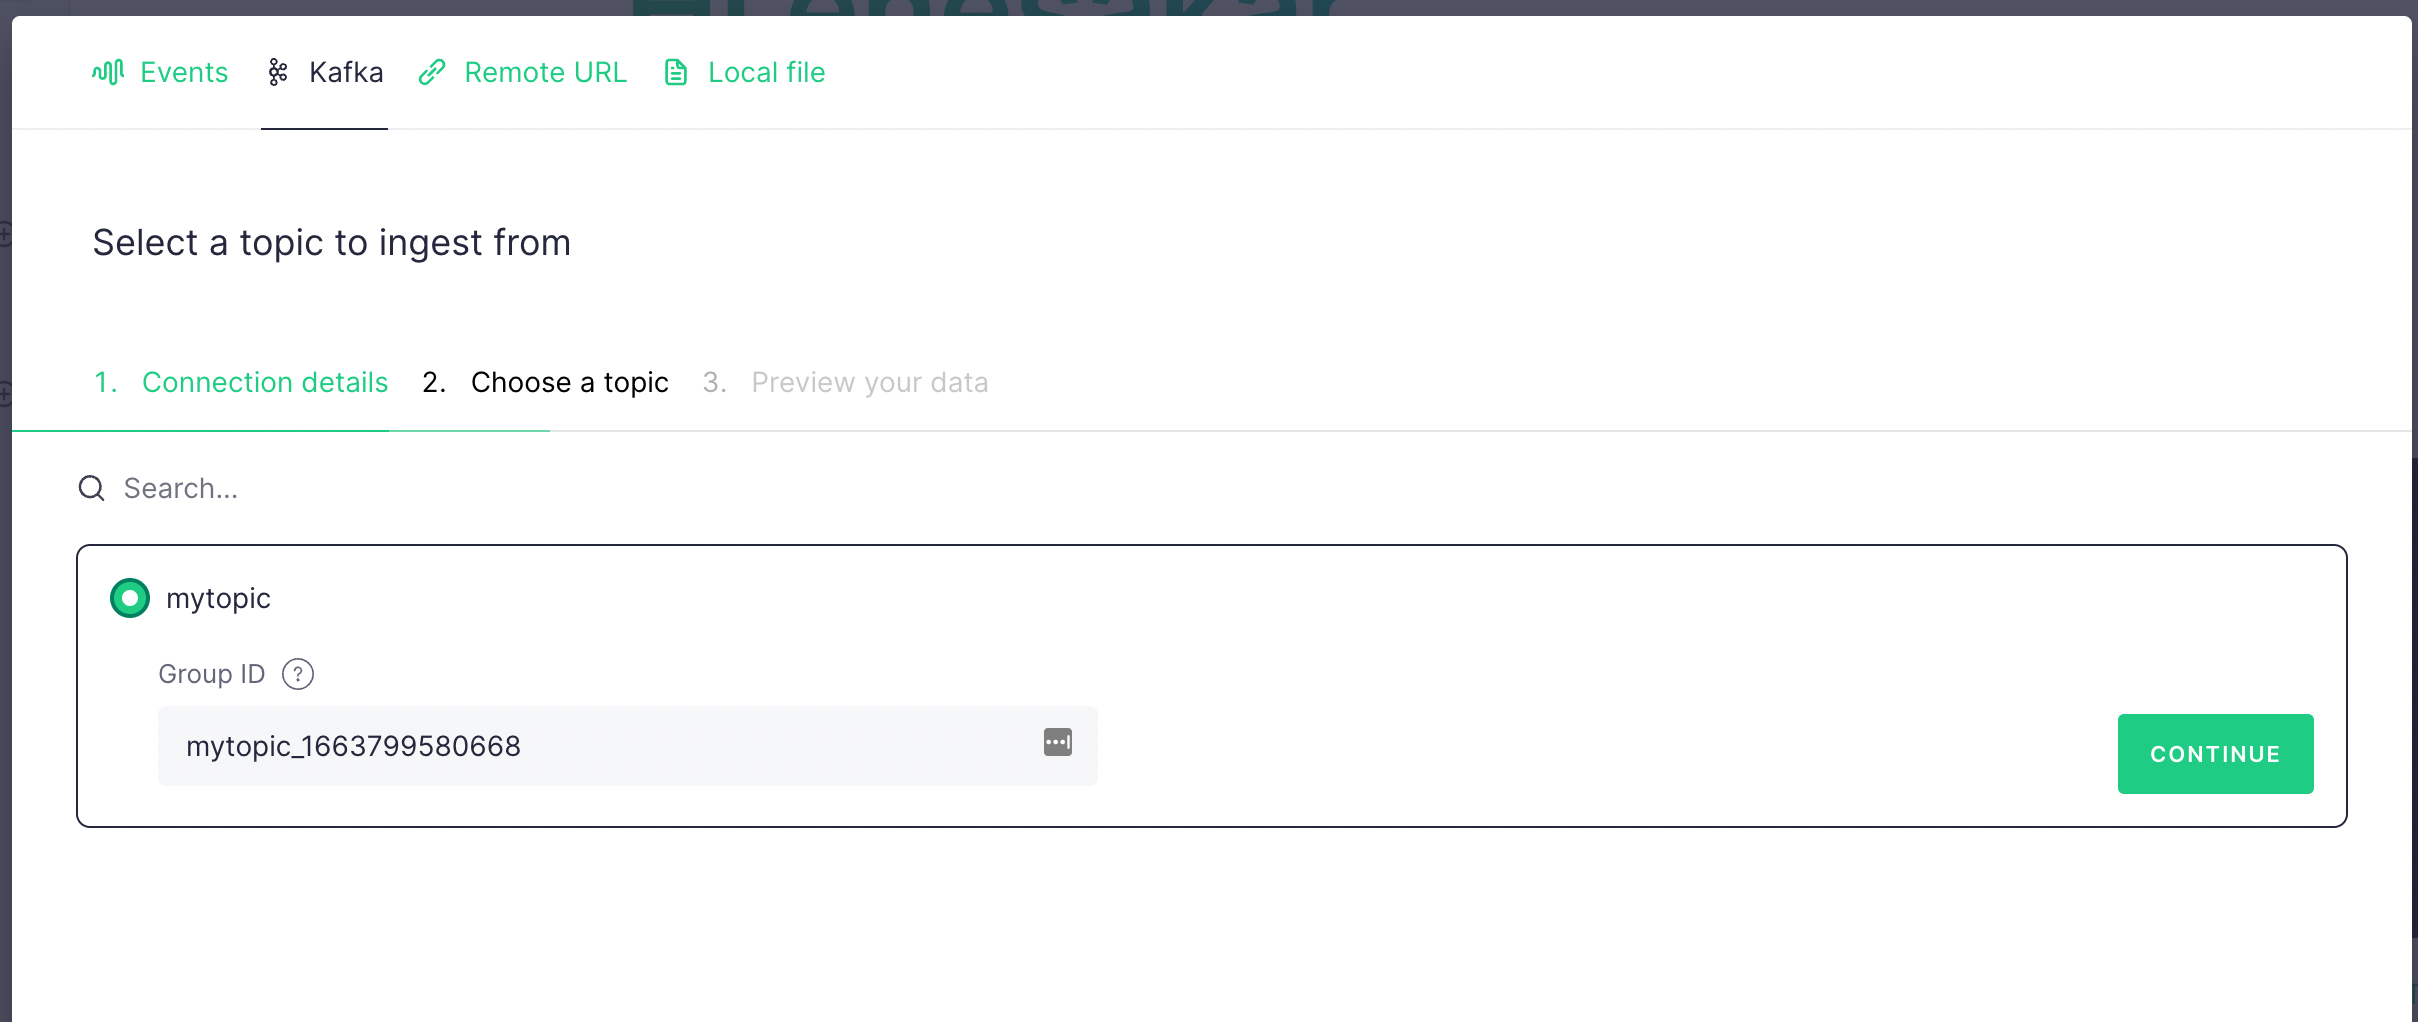
 If the connection is successful, then you should see the topic you have just
created. Select it and click
 Continue .
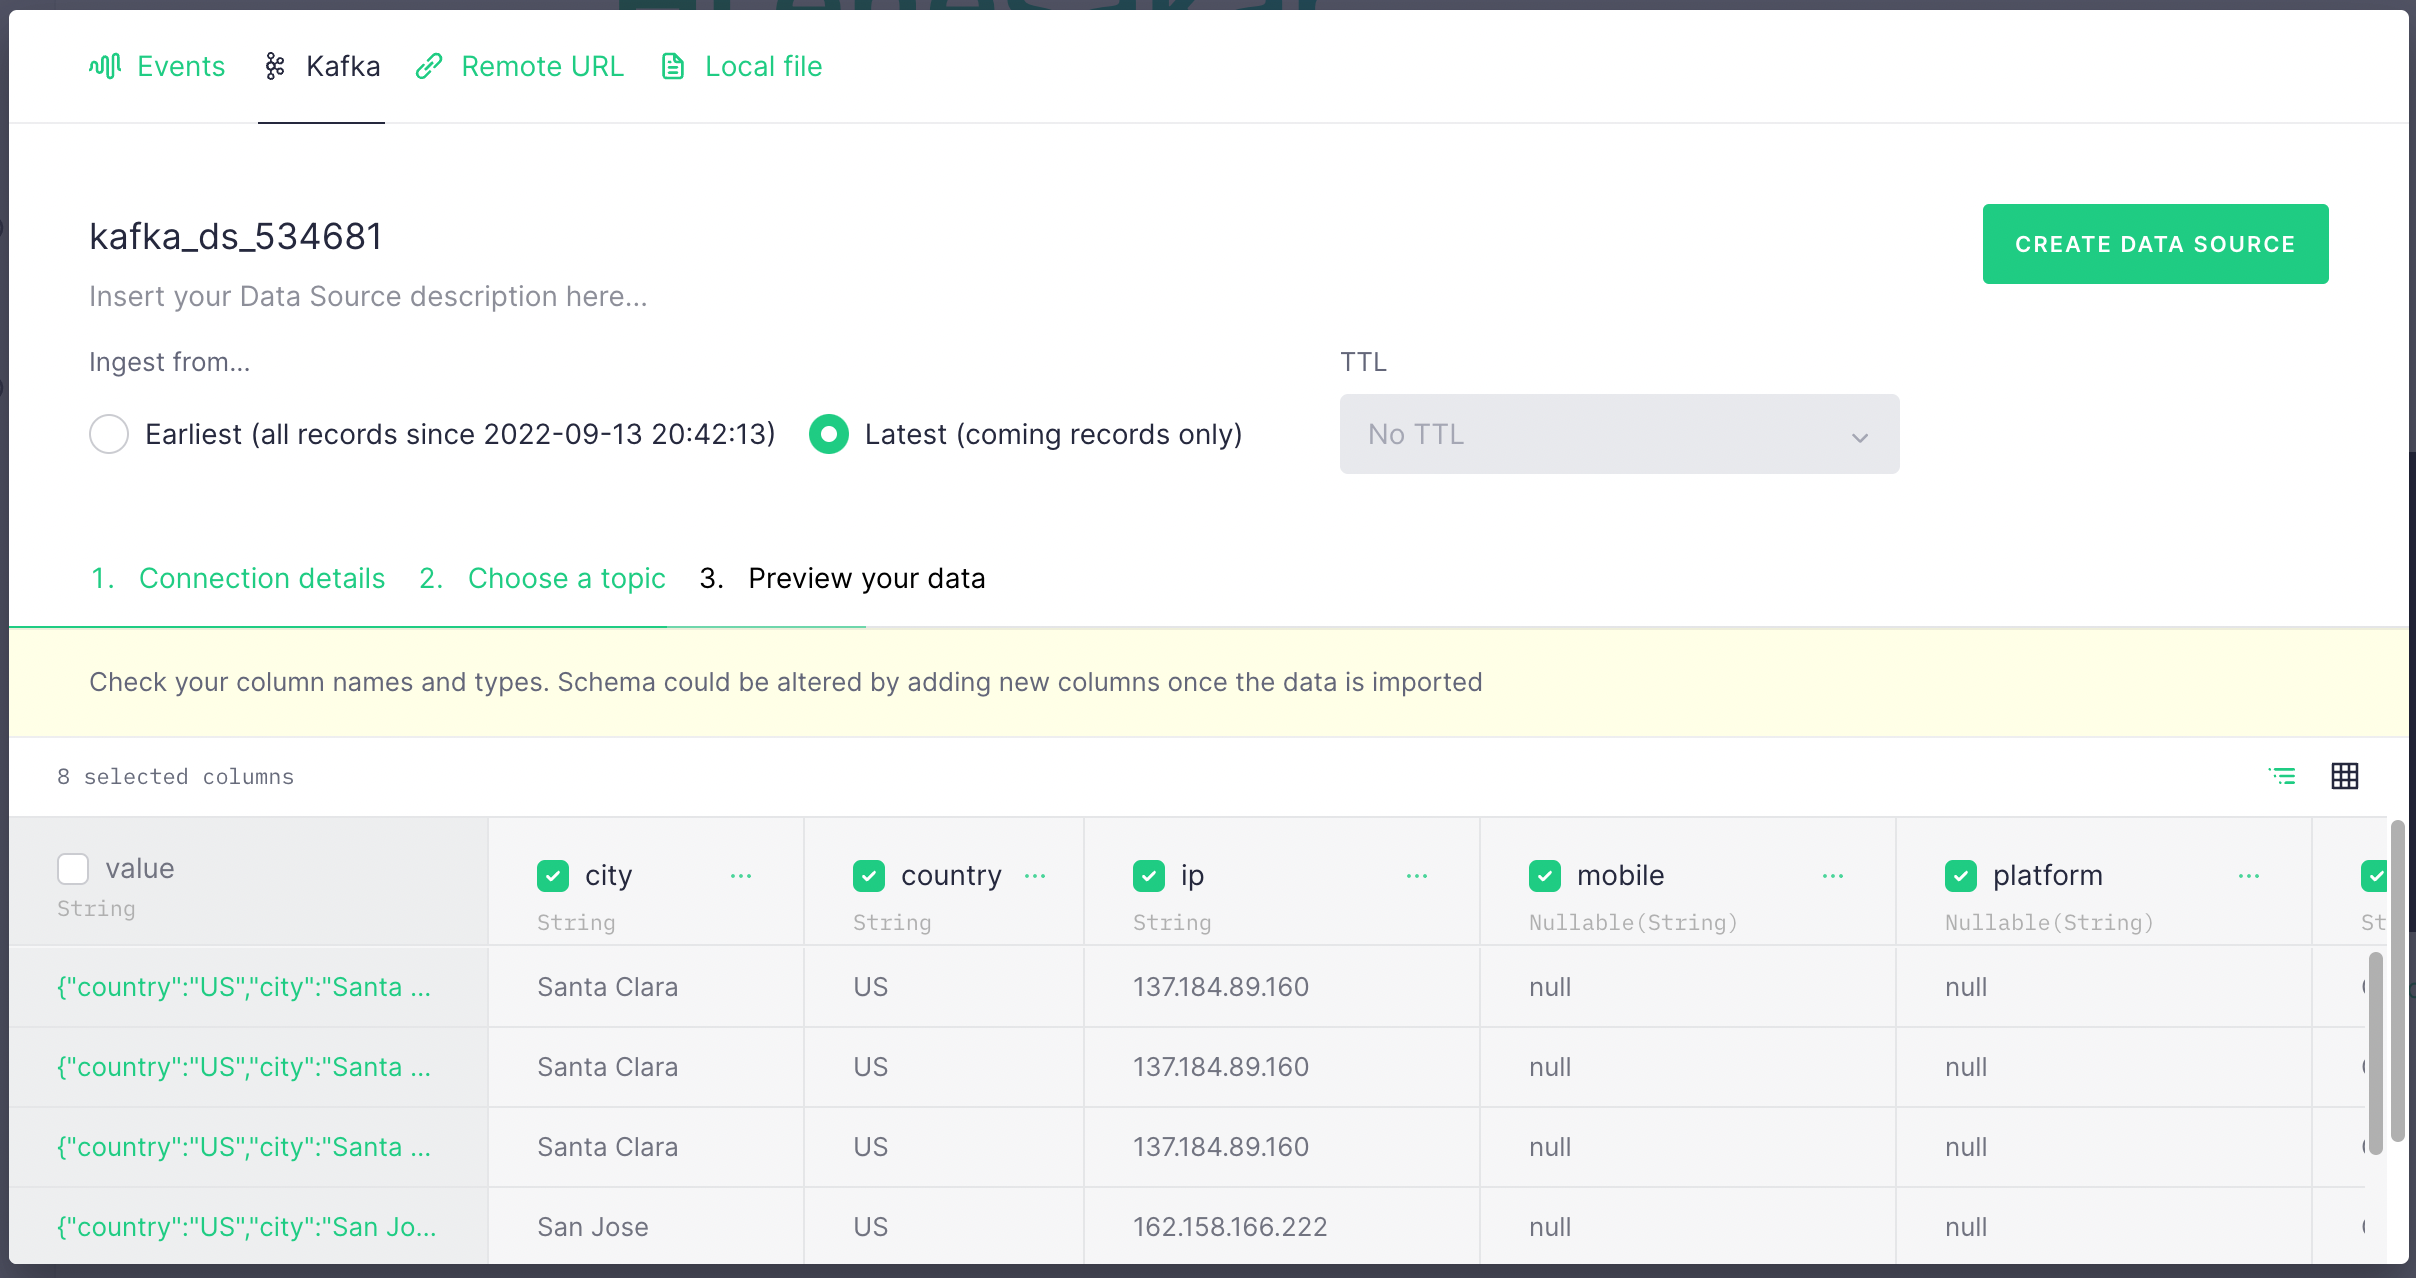
 In the next screen, you should see data is populated from your Kafka topic. It
should look like the below. Select
 Latest and click Create Data Source
 Click
Click Create Pipe on the next screen.
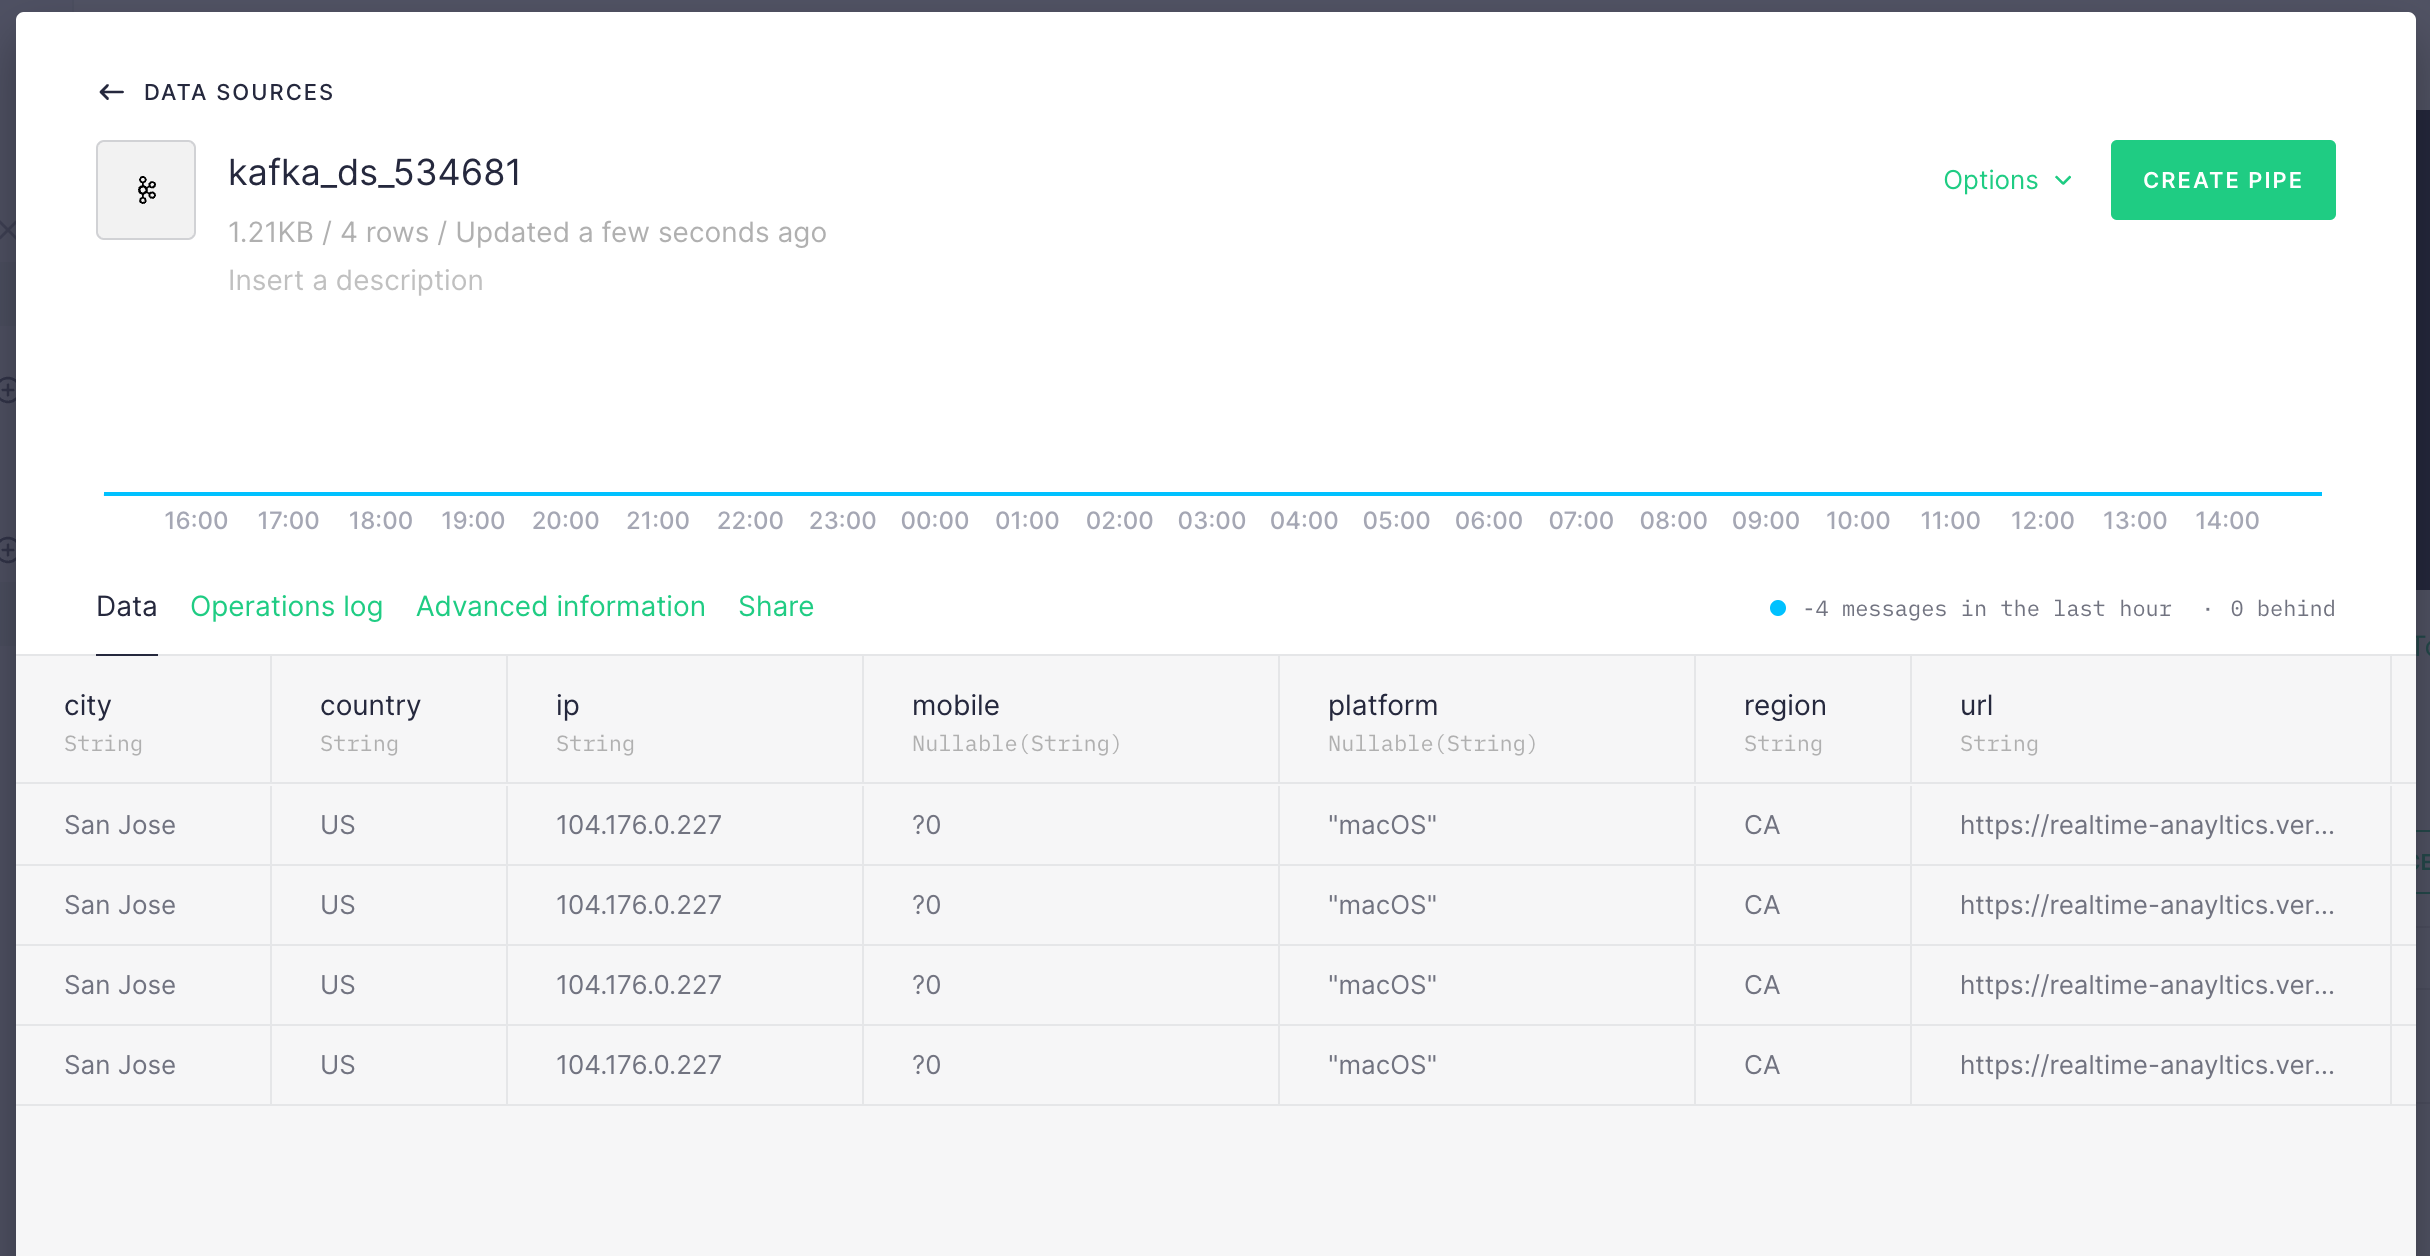 In the next page, you will see the query editor where you can execute queries on
your data pipe. You can rename the views. Update the query as (replace the
datasource):
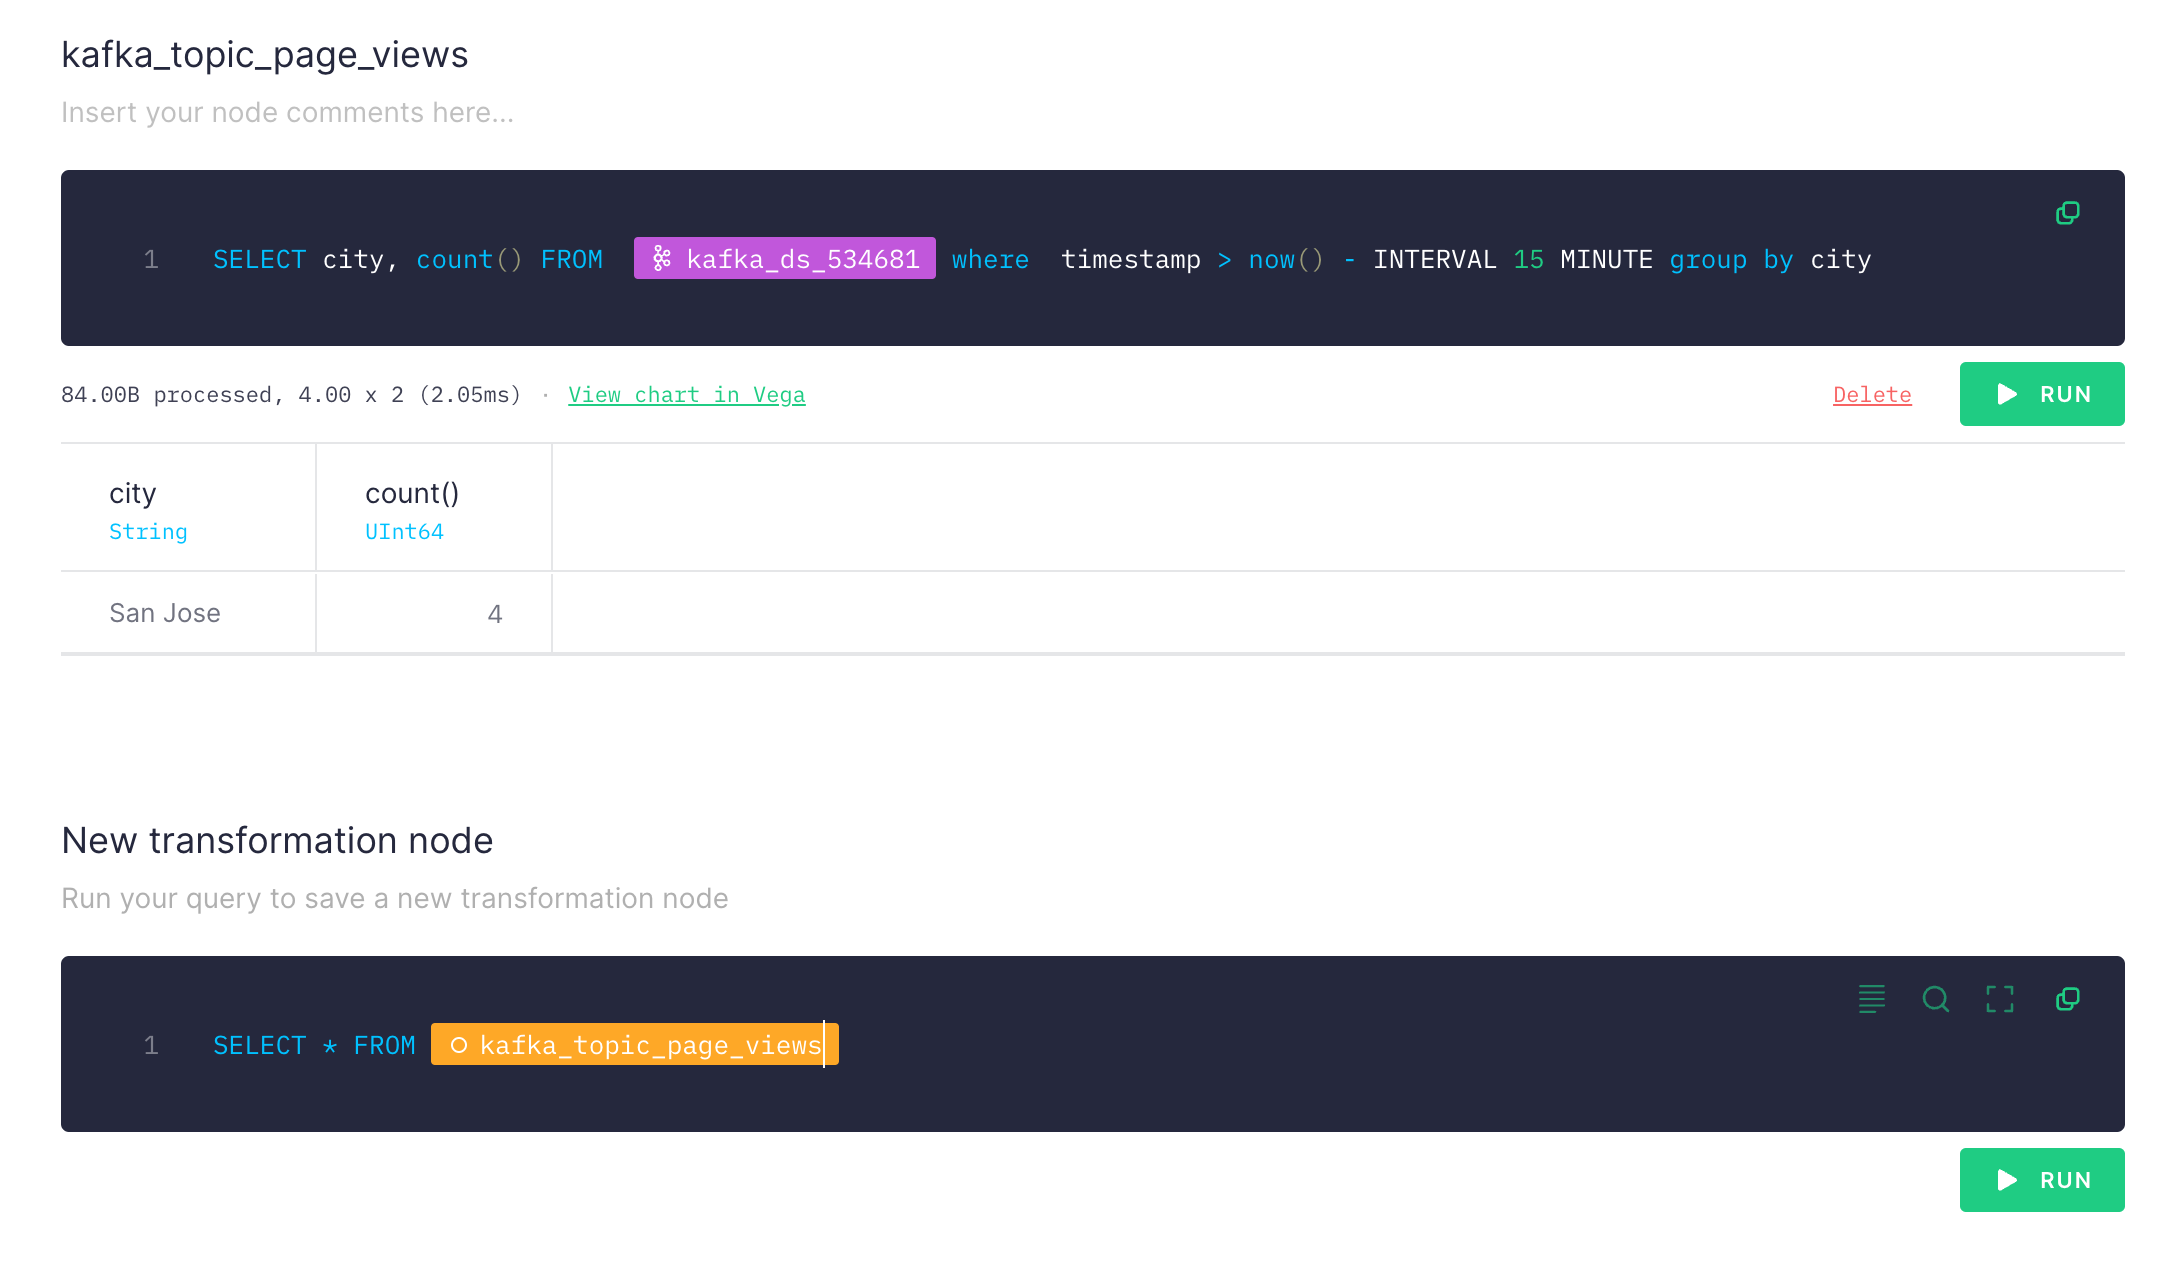 You should see the number of page view from cities in last 15 minutes. The good
thing with TinyBird is you can chain queries (new transformation node) also you
can add multiple data sources (e.g. Kafka topics) and join them in a single
query.
If you are happy with your query, click on
 Create API Endpoint at top right.
It will create an API endpoint which returns the result for your query.
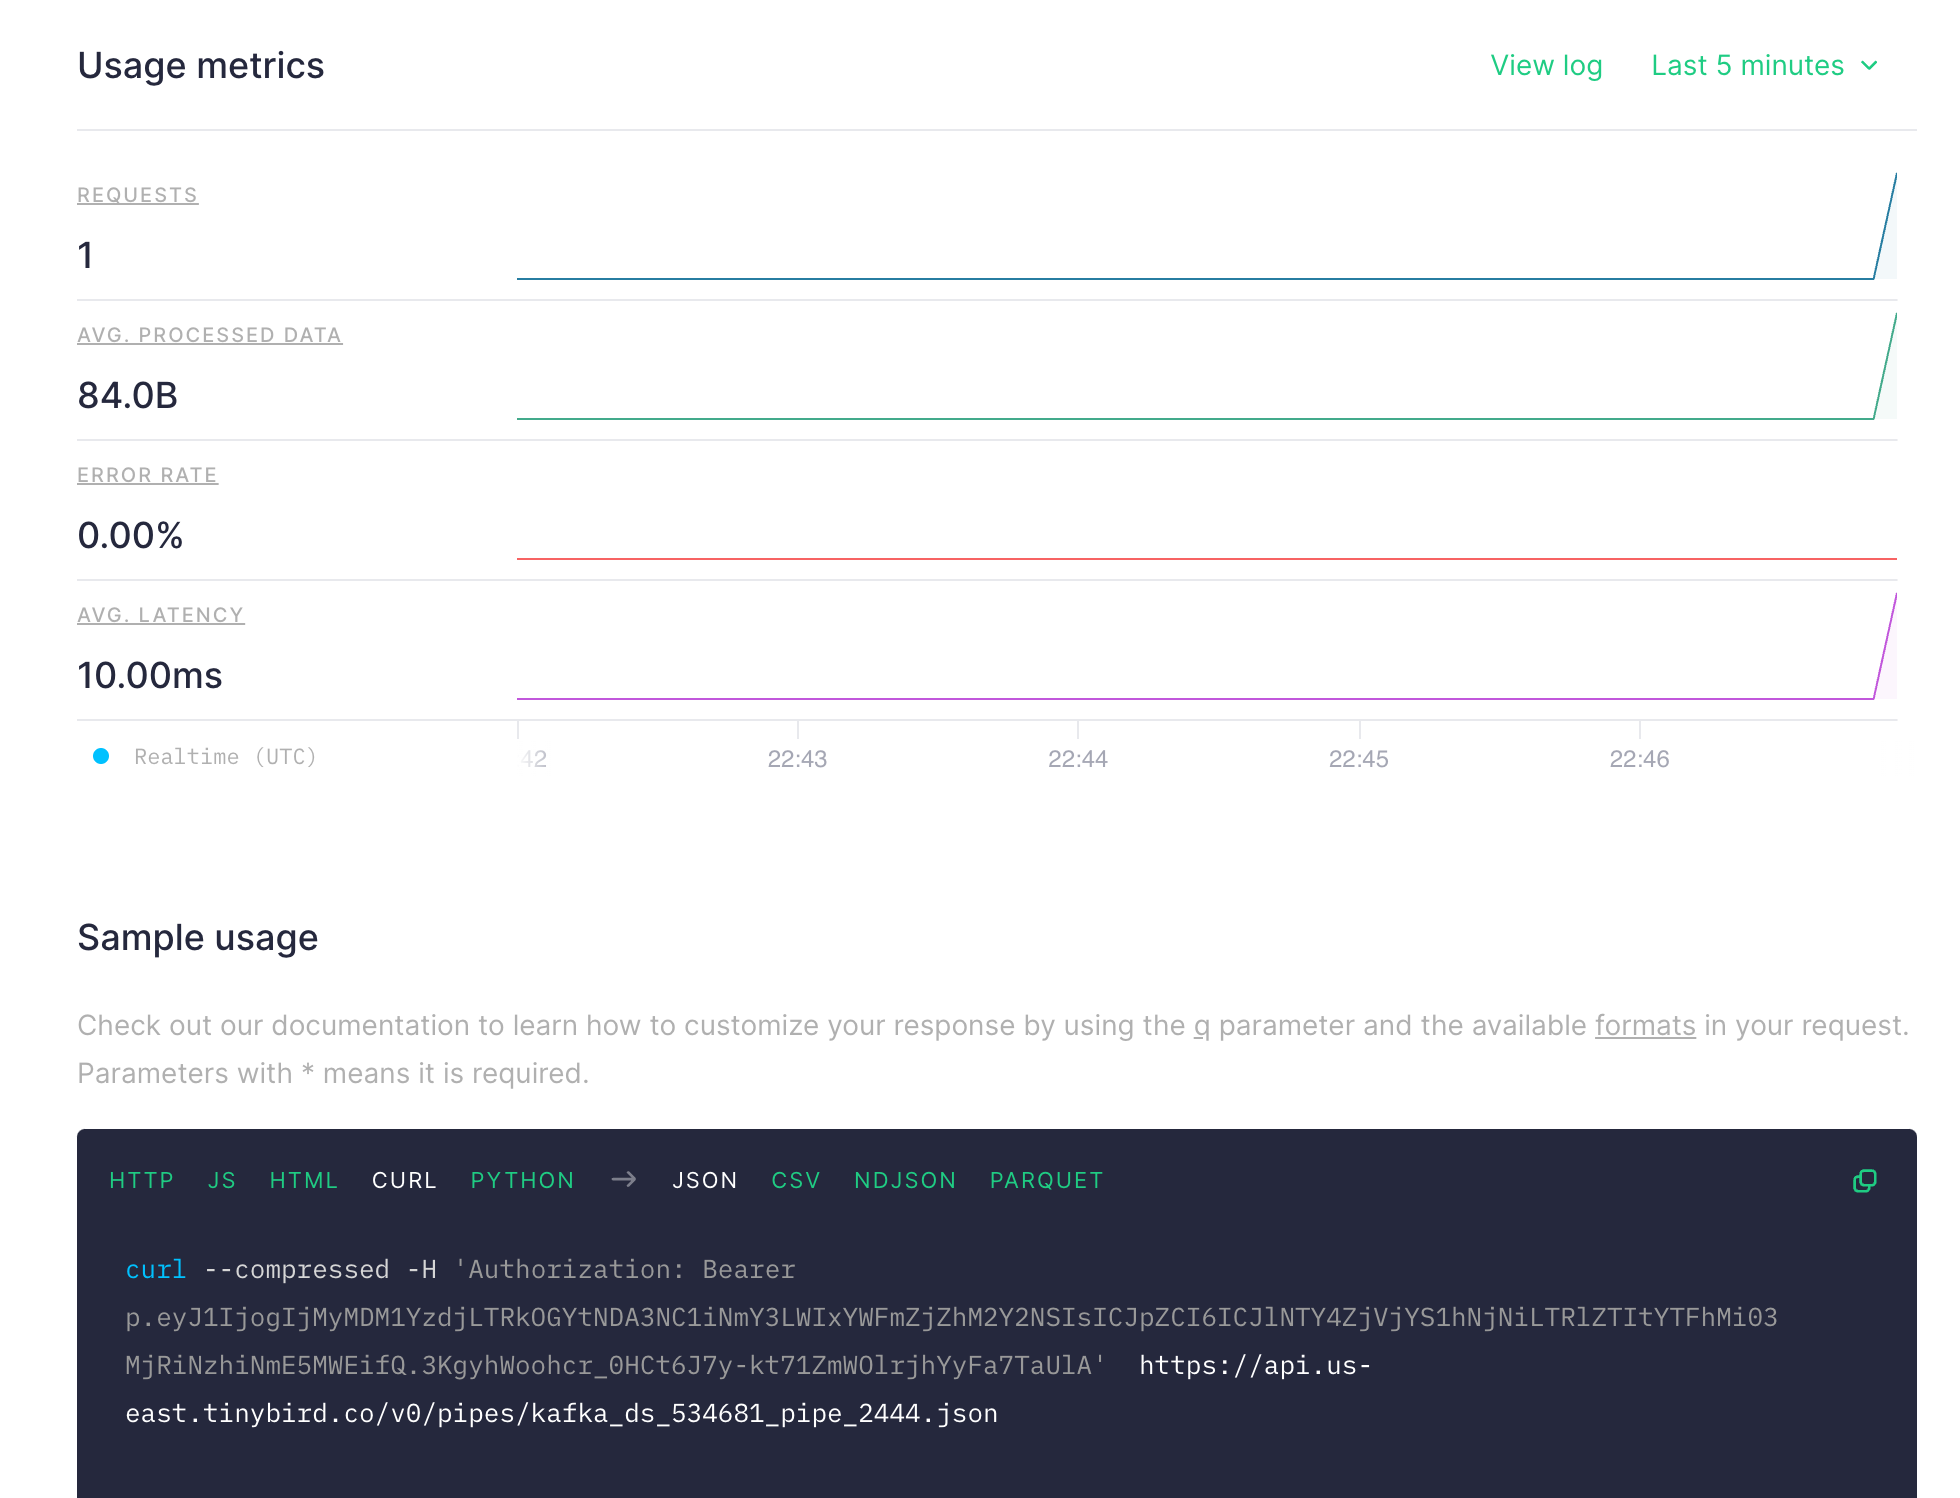 Copy the curl command and try, you should see the result like below:

